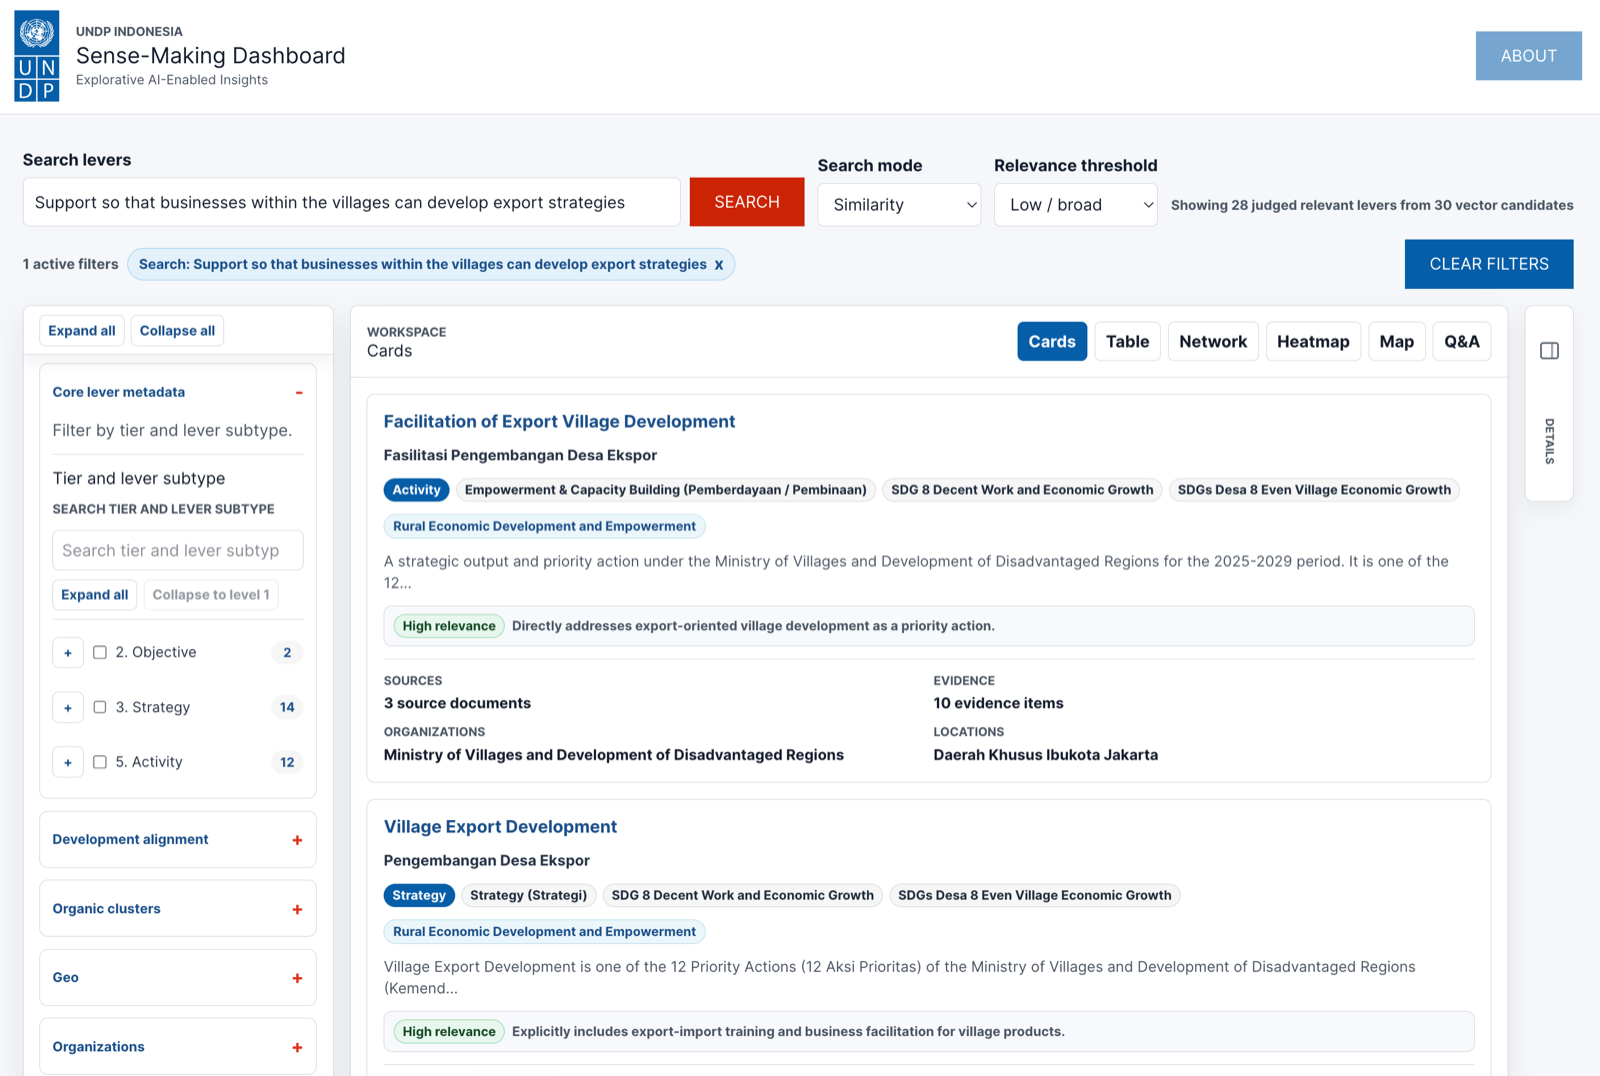
Search across policy and programme levers
Start with a plain-language question or topic, such as support for village enterprises, food security, digital villages, infrastructure, or underdeveloped regions.
UNDP Indonesia · Village development sense-making
The Sense-Making Dashboard helps users navigate policy, planning, and programme documents related to Indonesian village development and poverty alleviation. It turns complex source documents into an explorable map of levers, organizations, locations, themes, and supporting evidence.
Use it to search across documented initiatives, inspect relationships, compare patterns, and ask grounded questions with references back to the source materials.
Village development involves many plans, programmes, institutions, locations, and implementation activities. Much of the relevant information already exists, but it is spread across long and complex documents. This dashboard helps make that documented landscape easier to inspect, discuss, and validate.
Start with a plain-language question or topic, such as support for village enterprises, food security, digital villages, infrastructure, or underdeveloped regions.
Each lever is connected to source material where available, helping users move from an insight back to the document evidence behind it.
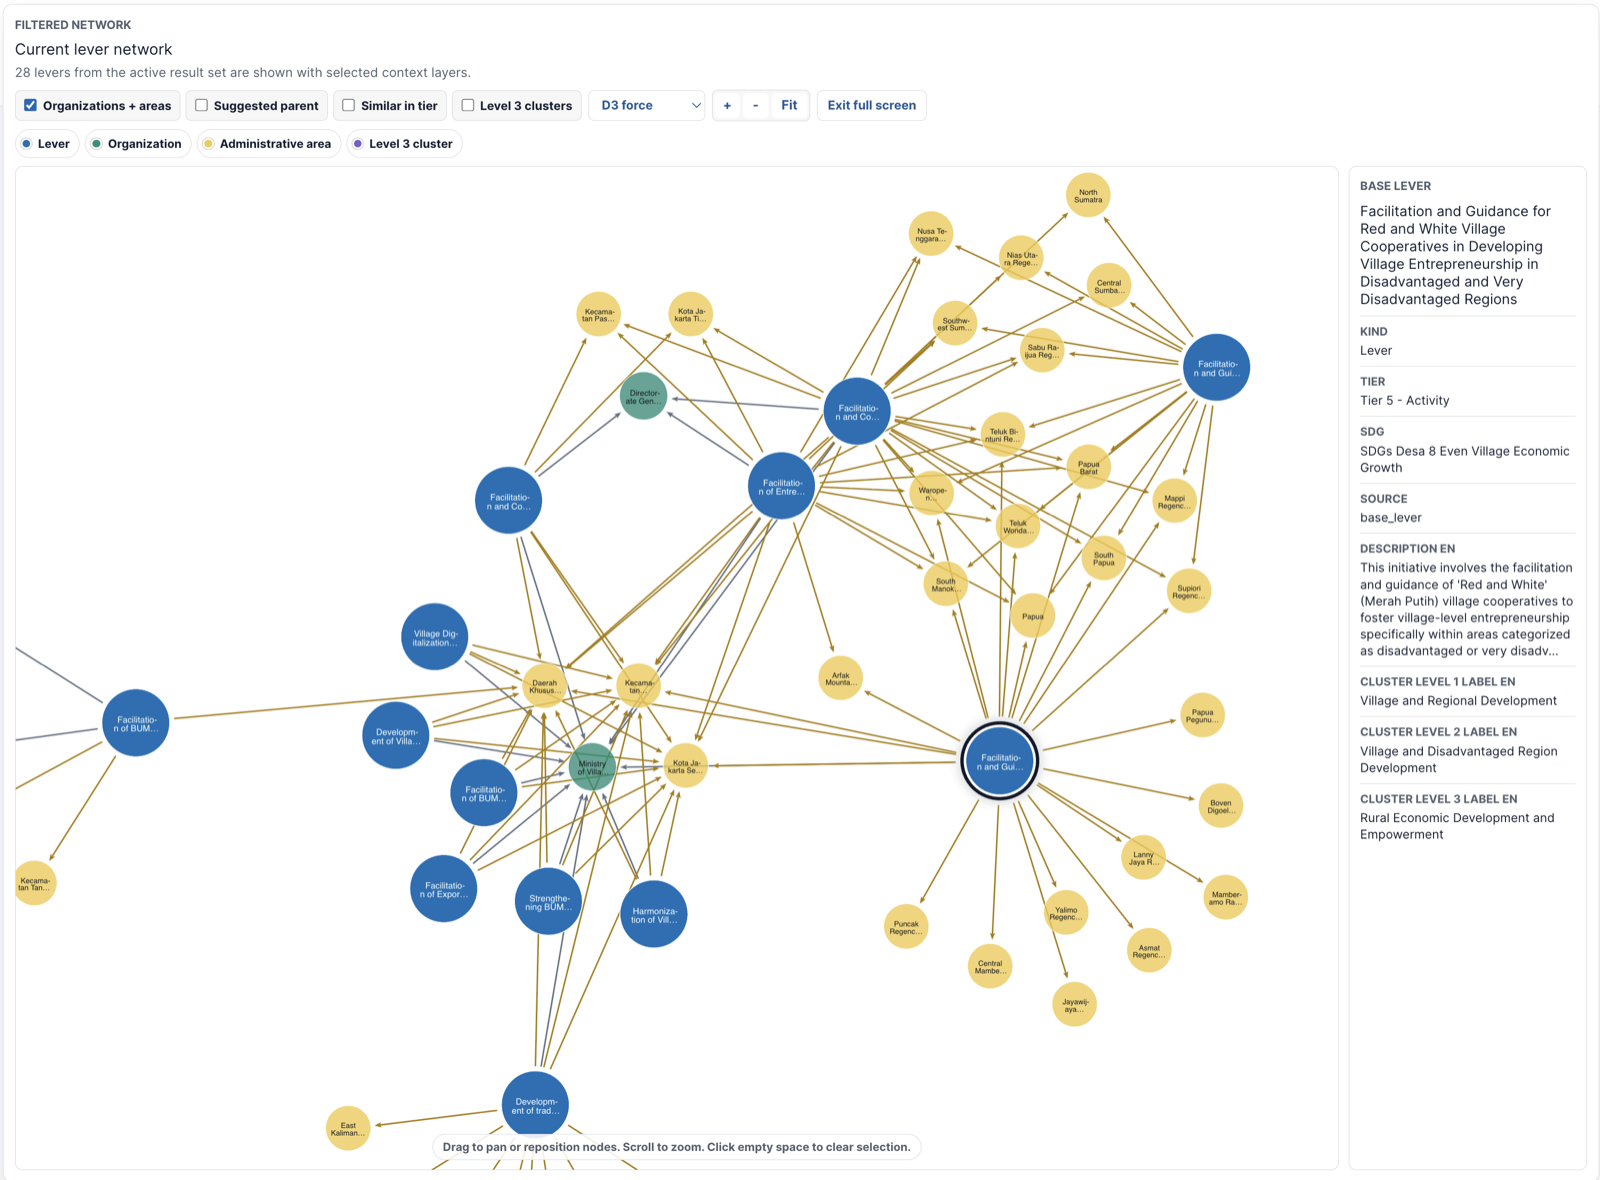
Network and heatmap views show how levers connect through organizations, locations, tiers, and development themes.
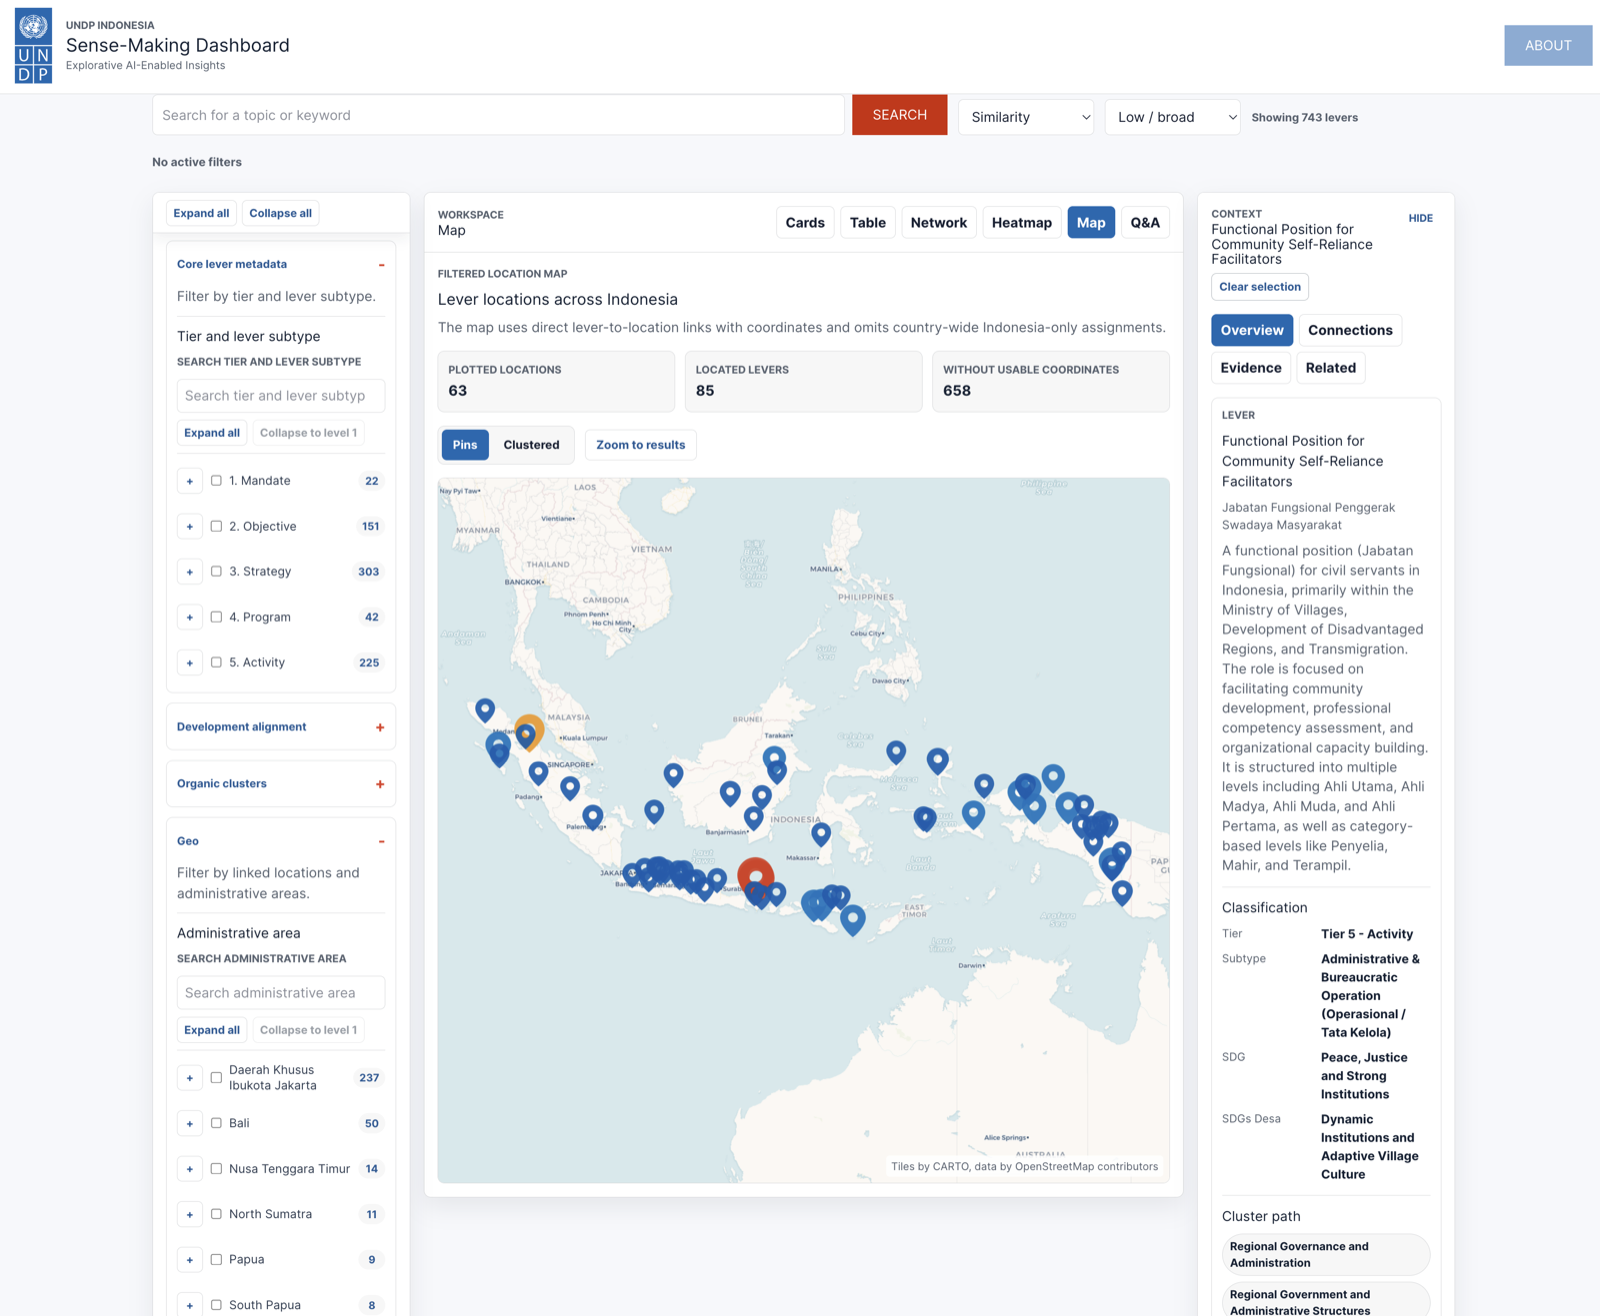
The map view shows where documented levers are linked to administrative areas or locations, while also making missing location data visible.
The Q&A view combines graph context and retrieved source evidence to generate cited answers for exploration and workshop discussion.
Selected policy, planning, evaluation, and programme documents are used as the evidence base.
The platform identifies documented mandates, objectives, strategies, programmes, activities, and other interventions that may contribute to village development outcomes.
Levers are connected to themes, organizations, locations, source documents, and related levers in a knowledge graph.
Users explore the evidence through cards, tables, networks, heatmaps, maps, and grounded Q&A.
The dashboard supports facilitated discussion by helping teams compare what is written in documents with what stakeholders know from implementation.
Browse levers as readable summaries with tags, descriptions, evidence counts, and related metadata.
Open cardsInspect relationships between levers, organizations, locations, clusters, and suggested policy connections.
Open networkThe dashboard is designed to support discussion, not to replace judgement. It helps facilitators and participants inspect what the documents say, identify possible relationships, and ask sharper questions about implementation, coordination, and policy coherence.
The dashboard reflects the documents currently included in the platform. It can reveal documented patterns and support discussion, but it does not prove what is happening on the ground. Users should check cited sources and validate findings with relevant stakeholders.
Open the dashboard to search, filter, visualize, and ask grounded questions across the current evidence base.